Business Intelligence is umbrella term includes ETL, Data Manipulation, Business Analytics, Data Mining and Visualization. It may relate with other trending statistics techniques. Lets study most commonly used techniques in BI and applies to achieve our goal by building our sample BI Application. We will use R Language (Open source Software for statistical computing and graphics) to build end-to-end business intelligence application or platform. R has powerful packages for Data Analysis, Regression Modeling and Visualization.
Overview of ETL
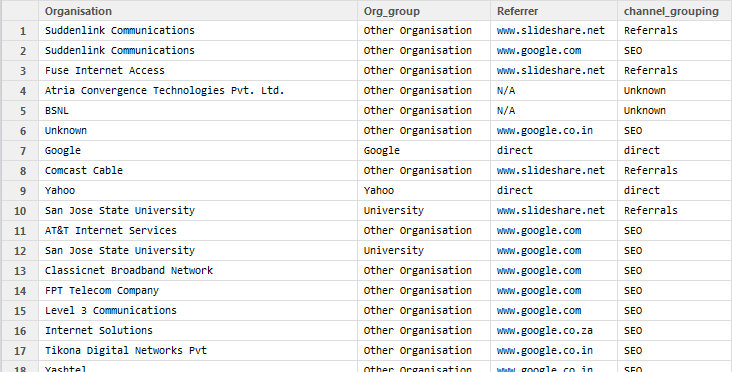
- Acquiring the Data
- Extracting the Data from the CSV
- How to Import the Data from Relation Databases
- Data Transformation using dplyr Package
- Exporting the transformed Data
ETL
The main functionality of Data Integration in Business Intelligence is to acquire the data from various source systems, change or modify the format of the data matches with Target and loading the data into the Target System. These processes are called Extract, Transform and Load. There are different products available in market to perform the ETL process and used based on criteria like Infrastructure, Scalability, Price, etc. I will see how to implement Import the Data from sources, applying important Transformation techniques and load the data into Target quickly using R.
Acquiring the Data
To start building our Business Intelligence Application we need a data. Let’s use some simple and trending Bike Sharing data set. Bike sharing systems are for renting bicycles where the process of obtaining membership, rental, and bike return is automated via a network of kiosk locations throughout a city. Using these systems, people are able rent a bike from a one location and return it to a different place on an as-needed basis. The Dataset collected from popular Data Science and analytics competition website
http://www.kaggle.com/c/bike-sharing-demand/data
The data set we selected for our development is in CSV format. But there might be requirement for you or need to extract the data from Database tables, Website, etc. For the reason, example code or recommended packages and links will be shared also.
Extracting the Data from Source
Before starting, I assume that you have R Studio installed in your platform. Readers can find plenty of tutorials online to learn R Basics and basic knowledge will be helpful and essential.
Please refer complete code used in this post.
https://github.com/kannandreams/R_Snippets/blob/master/R_ETL.R
Importing the Data from Relational Database
Generally any relation database can be accessed through ODBC Interface. R has provided RODBC library to connect and access. Advantage of using RODBC library is the function argument remains same and only the connection string details need to be changed according to our database needs. But there are specific backend libraries to connect with different databases. With respect to performance in data operations, using the native package will be good. Some of them are RMySQL, ROracle, RpgSQL. Consider as scenario, we wanted to access the same bike sharing data from any one of the database. Below is an example of reading from ODBC database and it will be helpful if you are using any source as database for your BI application development.
Importing Data from Non-Relational Databases
Non-Relational databases are like document based, key value store and used to store unstructured data which are different from RDBMS model. It will be mostly used in big data environment. R has provided various package to support and pull data from non-relational databases. For example, RCassandra library used to connect with Cassandra, rmongodb library for MongoDB.
Importing XML and JSON Files
XML and JSON are file format are mostly used in Web Service to transmit the data for request and response. XML and rjsonio libraries in R can be used to import XML and JSON Type file sources. Please refer the package on CRAN Website
http://cran.r-project.org/web/packages/XML/index.html
http://cran.r-project.org/web/packages/RJSONIO/index.html
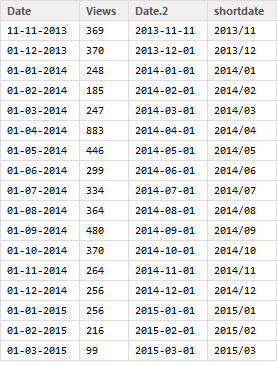
Transforming the Data
In the previous section we learned how to bring the data from various source into R. Now we have the raw data in R in the form of data frame. Data Manipulation is very important part of ETL process by applying the business rules to output the data we required and pass them to target system.
Using dplyr Package
dplyr is a package which provides a set of tools for efficiently manipulating datasets in R. For Example, In SQL, there are some of commonly used data manipulation techniques like selecting the columns, filtering the records, sorting, grouping, etc. Similarly we can do the same functionalities in R using dplyr.
Deriving new Attributes or Metrics
Using dplyr package, we can even preform multiple operations in single line by nesting the function over function. It is similar like writing SQL Queries. Let’s see some example below with additional options like ordering by and derive new column based on existing columns. Creating derived columns based on other columns is called mutate.
Exporting the Data to Target
We are now at the end of the ETL process stage. Manipulated Data resides in R as dataframe. Now we should know how to export this dataframe into Target system or Outbound files like CSV, Tab, and Text file.
Exporting the Data to Database
We have seen how to import the data from database using ODBC library. There are other packages on CRAN which provide interface to database. Let consider our Target database is SQLite (Open Source transactional SQL Relational database). Please refer https://sqlite.org/ to understand the features .We wanted to load the data frame from R into target table resides in SQLite .For this, RSQLite Package provide an interface to SQLite database. SQLite also uses the same syntax of SQL Language.Any Database starts with creating a database and creating the table definition and loads the data with SQL Data Manipulation Language. We can achieve everything within R through RSQLite package.

 Machine Learning has four common classes of applications: classification, predicting next value, anomaly detection, and discovering structure. Among them, Anomaly detection detects data points in data that does not fit well with the rest of the data. It has a wide range of applications such as fraud detection, surveillance, diagnosis, data cleanup, and predictive maintenance.